Article
Inside a datacenter: the rack, the water and the power
Four figures you can play with to see what keeps an AI datacenter running: the whole building and its flows, 10 kW servers, a water loop that carries away 120 kW per rack, and a power chain that never leaves the rack without electricity.
By Le Lab X
- Author
- Le Lab X
- Published
- Reading time
- 5 min read
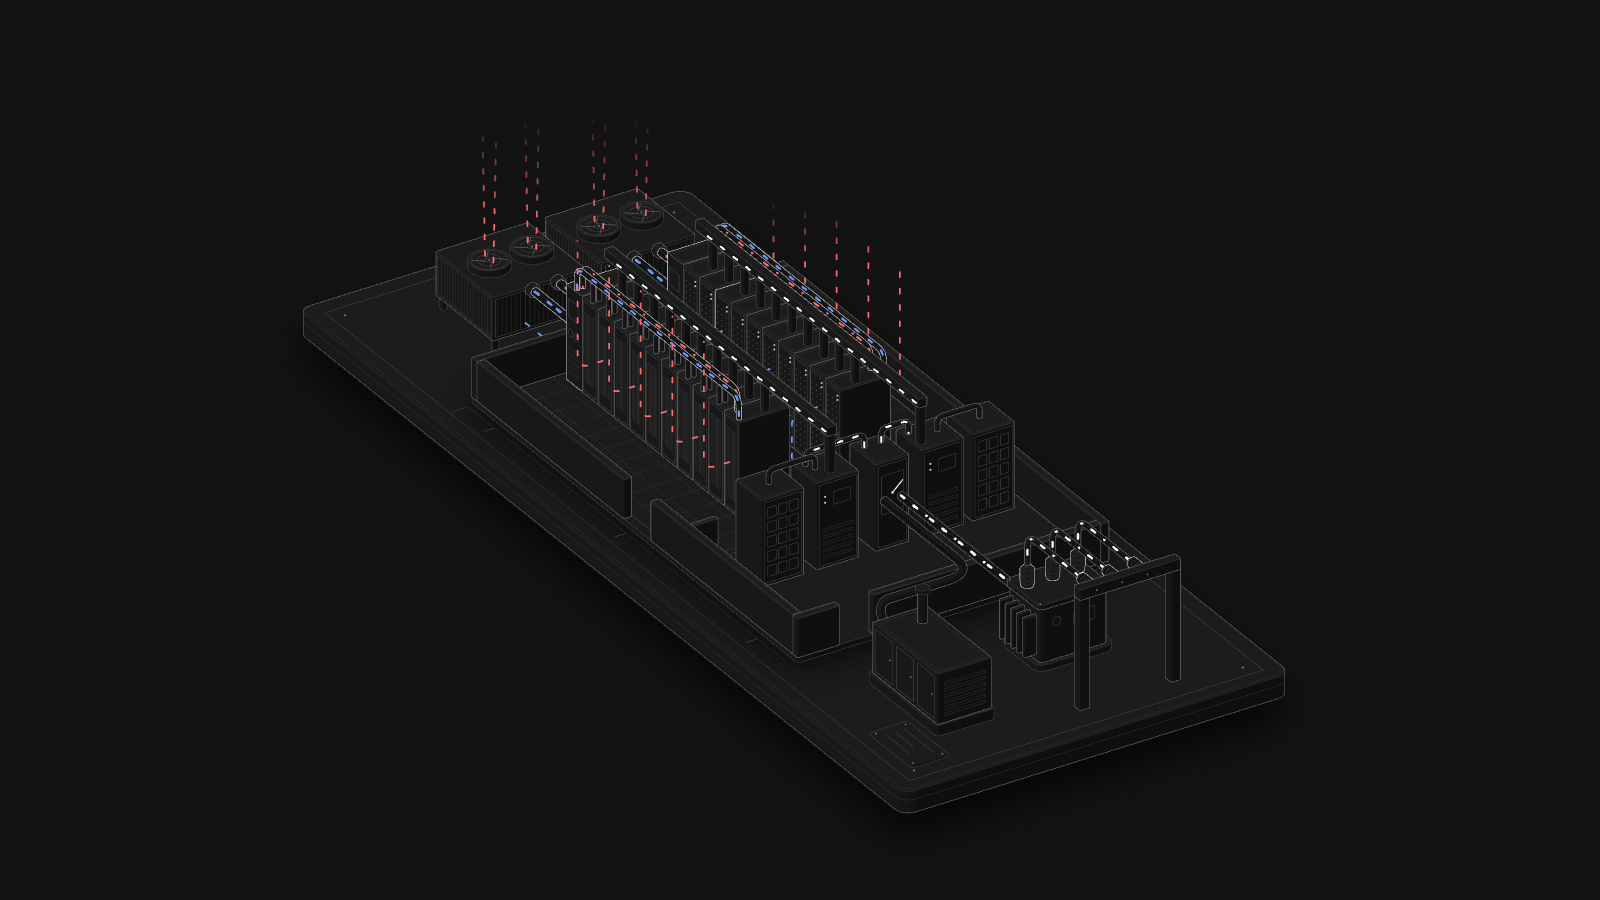
From the outside, a datacenter looks like a warehouse behind a fence. Inside, three systems work together: servers that turn electricity into computation, and therefore into heat; a water loop that carries that heat away; and a power chain that makes sure the electricity never runs out. You can play with the four figures in this article using the mouse or the keyboard: the first shows the whole building, and the next three open up each of these systems.
This model brings the three systems together in a small, fictional building: twenty 120 kW racks, or 2.4 MW of compute. The moving lines are the flows. Power arrives on the right at high voltage, goes through the transformer and the UPS units, then runs along the busways above the racks. Cold water, in blue, leaves each CDU for the racks and comes back warm, in red; the building water carries that heat outside to the dry coolers, whose fans hand it to the air. A click isolates one flow at a time.
The rack, the basic unit
Everything starts with a standard cabinet: 19 inches wide, with its height counted in units of 44.45 mm. An AI server such as NVIDIA's DGX H100 takes up 8 units, carries 8 GPUs and can draw up to 10.2 kW. Each of its GPUs is rated at up to 700 W: on their own, the GPUs account for more than half of that power.
With four servers plugged in, the rack draws 40.8 kW. In 2026 the Uptime Institute measured a typical density of about 11 kW per rack, and 4 to 5 kW remains the most common density. The latest AI racks go much further: NVIDIA gives about 120 kW for a GB200 NVL72 rack, which brings together 72 GPUs and 36 processors.
The water that carries the heat away
Almost all the electricity a server uses ends up as heat. The GB200 NVL72 is designed for liquid cooling: liquid flows through its compute trays and into cold plates mounted directly on the chips.
The figure follows a closed loop. A pump pushes cold water to the plates; the water warms up against the chips, then, in a plate heat exchanger, hands its heat to a second circuit: the building's. The Open Compute Project calls the equipment that separates these two circuits and controls flow, pressure and temperature a CDU (coolant distribution unit).
The calculation fits on one line: the heat removed equals the flow rate, times the heat capacity of water (4.18 kJ per kilogram per degree), times the temperature rise. OCP recommends about 1.5 L/min per kW. For 120 kW, that makes 180 L/min, or 3 litres a second, and the water warms by 9.6 °C. Turn the pump down and the heat to remove does not change: the temperature rise goes up instead.
This cooling has a cost, measured with PUE: the site's total energy divided by the energy used by the IT equipment. The Uptime Institute reports an average of 1.52 in 2026, and Google announces 1.09 across its fleet. At 1.52, every kWh of computation brings about half a kWh more for cooling, electrical losses and the rest of the building.
The power that must never fail
In France, a site this size does not plug into the neighbourhood grid. Enedis, the distribution operator, connects up to 250 kVA at low voltage and up to 40 MW at medium voltage; beyond that, it is RTE's transmission grid. Datacenters connected to RTE have connection capacities of 40 to 240 MW.
Power arrives at high voltage, often 20 kV in France, and a transformer steps it down to 400 V. It then goes through a transfer switch, which chooses between the grid and the generator, and then through a UPS before reaching the rack.
Cut the grid in the figure. A double-conversion UPS, the most common mode in large datacenters, already powers the rack all the time: when the grid fails, it moves to its batteries with no transfer time at all. Those batteries only last a few minutes, typically 5 to 10 according to Schneider Electric. Their job is to wait for the generator.
The generator starts and runs up to 1,500 rpm, the speed of a four-pole alternator on a 50 Hz grid, and then the transfer switch hands it the load. The American standard NFPA 110 classifies these systems by their delay: a Type 10 system must restore power within 10 seconds. Nothing requires this of a datacenter, but it is a common design choice. When the grid comes back, the transfer switch moves back to it and the generator stops. Throughout, the rack has noticed nothing.
At the scale of a country
The International Energy Agency estimates that datacenters used about 415 TWh in 2024, or 1.5% of the world's electricity, and expects about 945 TWh in 2030. In France, RTE counts almost 1 TWh in 2025 for sites connected to its grid, and 3 TWh on the Enedis grid in 2024. RTE also notes that these sites use on average only 22% of their connection capacity.
Sources
NVIDIA: DGX H100/H200 and DGX GB200 user guides, H100 datasheet. Uptime Institute: Global Data Center Survey 2026. Open Compute Project: Liquid to Liquid CDU Test Methodology and Performance Rating (2024). NIST Chemistry WebBook: heat capacity of water. Google: datacenter efficiency (second quarter of 2026). Vertiv: types of UPS. Schneider Electric: white paper 229 on batteries. Cummins: overview of the NFPA 110 standard. CRE: Enedis connection tariff (2026) and retail market observatory for the fourth quarter of 2025. RTE: Bilan électrique 2025. IEA: Energy and AI (2025).
The figures are drawn with Anatomy, a free (MIT-licensed) kit for interactive isometric figures.
